InfraPulse · GPU yield measurement

Your dashboard says 100% busy. How much did the GPU actually deliver?

Allocated, busy, and delivered are three different numbers, and most fleets only plot the first two. InfraPulse measures the third — per GPU, per hour — and prices the gap in sellable GPU-hours from hardware you already own and cannot get more of.

No agent to install. No access to anything. No NDA required. Nothing published without your say-so.

One GPU-hour measured three ways: allocation 100%, busy about 100%, delivered a fraction of the hour
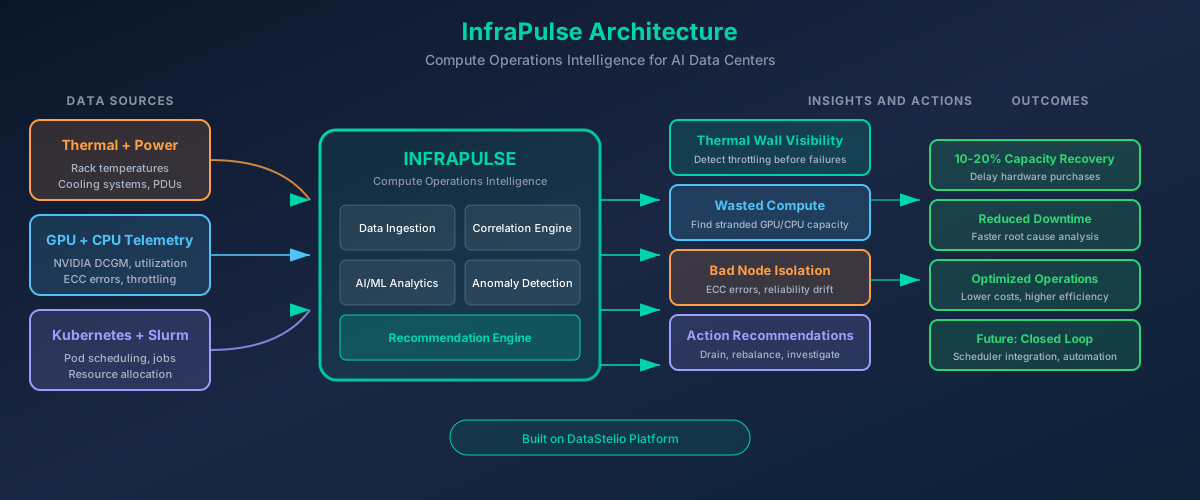
InfraPulse architecture: GPU telemetry, throttle and health signals, scheduler context, metrics exports and node/facility data flow into a read-only platform that collects, baselines, attributes and accounts for delivered GPU-hours, producing a thermal map, attributed findings, recommendations, drift alerts and a daily yield report
Telemetry you already have, in on the left. Findings you can act on, out on the right. Nothing in the middle writes to your scheduler or your clocks.

"Utilization" is three numbers hiding under one word

A GPU can be fully allocated, report 100% busy, and complete almost no math in the same minute. The telemetry to see this exists in DCGM and amd-smi. Almost nobody plots it.

1 · Allocation

What the scheduler shows

"8 of 8 GPUs assigned." Kubernetes and Slurm count a GPU as used the moment it is handed to a job — whether the job is training or waiting on a data loader.

2 · Busy

What nvidia-smi shows

The fraction of time at least one kernel was executing. One thread on one SM reads as 100%. Teams have reported 100% busy at roughly 20% MFU.

3 · Delivered

What the silicon completed

SM activity, tensor-core activity, memory bandwidth, and the throttle reasons behind every dropped clock — turned into effective GPU-hours against the hours you paid for.

Where the GPU-hours go

The losses are not one big hole. They are a dozen small ones that compound, and none of them shows up as "low utilization" in the standard view. All of them show up on the invoice.

Thermal and power throttling

Dense racks hit limits and silently drop clocks. The device reports busy while delivering a fraction of rated FLOPs. DCGM records why; almost nobody plots it.

Data starvation

Storage and dataloader stalls leave GPUs waiting between batches — busy to the scheduler, idle to physics.

Gang-scheduling stragglers

A 64-GPU job waiting on four stragglers holds sixty warm GPUs that compute nothing.

Reliability drift

ECC and XID events, a node that has quietly become the slow one in every collective — losses that look like application bugs until you line up the telemetry.

Checkpoint and restart cycles

At scale hardware fails constantly, and checkpoint/restore plus stragglers eat meaningful fractions of training time.

Static partitions and human-shaped demand

Fixed slices per team and working-hours workloads leave capacity committed but unproductive nights and weekends.

No public source attributes the split between these mechanisms for a real fleet. That absence is the product: a per-GPU, per-hour account of delivered throughput, with each loss named and priced.

How InfraPulse works

Read-only from day one. It reads the telemetry your GPUs already emit and does the accounting nobody has time to do by hand.

1

Collect

A read-only collector reads DCGM (NVIDIA) or amd-smi (AMD) fields — SM activity, tensor activity, memory bandwidth, power, temperature, clock-throttle reasons, ECC/XID — plus scheduler context from Kubernetes or Slurm. Or skip the collector entirely and export 24 hours from Prometheus.

2

Baseline

Every GPU is baselined against itself and its SKU rating under real load, so drift shows up as drift — not as noise, and not as an application bug.

3

Account

Delivered throughput is rolled up per GPU, per node, per hour. Agents attribute each shortfall to a cause, price it in GPU-hours from your own cost basis, and recommend a reversible next step — a number you can defend in a budget meeting, and a person approves anything that follows.

What leaves your network

Every serious conversation ends at this question, so here is the answer in writing. The collector is read-only and runs where you put it. What leaves is numeric metric samples with hostnames you choose — no job names, no code, no payloads, no credentials, no outbound access from us to you. Path B sends nothing at all until you export it yourself.

  • Read-only: no scheduler hints, no clock changes, no drains
  • Metric samples only; you control the hostname mapping
  • No inbound access, no shared credentials
  • Findings are yours; nothing is published without written consent

See the interactive thermal map demo — rack heat, throttle reasons, and delivered throughput on one hall

Two ways to start, both free during the design-partner phase

We are working with a small number of GPU operators right now. You get a written root-cause analysis of where your effective compute goes. We get telemetry we cannot get anywhere else.

Path B · lowest commitment

Send 24 hours of metrics, get a written analysis

A dcgmi dmon capture, a Prometheus export, or amd-smi output from any nodes you run. We return a written breakdown of delivered throughput per GPU, the causes behind every shortfall, and what it cost in GPU-hours.

  • No agent to install
  • No access to anything
  • No NDA needed
  • Turnaround measured in days, not weeks
Send 24h of metrics
Path A · continuous

Install the read-only collector in 15 minutes

For operators who want the account to run continuously. One container or systemd unit per node, read-only, with a written one-pager on exactly what leaves the network before anything is deployed.

  • 15-minute install with your engineer on the call
  • Per-GPU self-baselining from the first hour
  • A live finding reviewed together mid-flight
  • Two-page design-partner agreement, no fees
Book a 15-minute install

Built for the people who sell GPU-hours

In a sold-out market nobody feels slack, so "how much are you wasting?" is the wrong question. The right one is how many sellable GPU-hours a fleet can deliver from iron that is already racked. Semiconductors have a word for that: yield.

Primary

Neocloud and GPU cloud operators

Bare-metal and VM GPU providers — NVIDIA or AMD — whose margin is the difference between the throughput a node is rated for and the throughput it delivers, per contract, per hour.

Compute marketplaces and indexes

Anyone scoring providers on price and availability but not on delivered throughput. The provider-basis gap is measurable from a 24-hour export.

Enterprise AI platform and HPC teams

Shared internal clusters on Kubernetes or Slurm where allocation reads full, queues are long, and nobody can say where the hours went.

Reads from what you already run

NVIDIA DCGM AMD amd-smi / ROCm SMI Prometheus exports Kubernetes Slurm Redfish / IPMI (roadmap)

From the research

Essay · September 2026

Why did CPUs never have this problem?

What "GPU utilization" actually measures, a public production trace where two-thirds of one-minute samples record a duty cycle of exactly zero, and why the operating system that saved CPUs from this has no GPU equivalent. Ends with six questions only people who run real clusters can answer.

Read the essay

If this described your fleet a little too accurately

Send 24 hours of metrics and get a written analysis back. Or tell us the three-numbers picture is wrong — that is useful too, and we would rather hear it now.